


Question 1
⇓
⇑
A. Cross-industry standard process for data mining

In an era of rapid globalization and technological advancements, Kasneb's cutting-edge syllabuses are designed to meet the dynamic demands of today's market. Our competency-based approach will boost your global competitiveness and propel you to the pinnacle of success. Join us on the journey to the top!
Question 2
⇓
⇑
C. Statements 1 and 4 contain the formulas for variance and standard deviation of a sample
Question 3
⇓
⇑
A. Data mining
Data mining is the process of discovering previously unknown patterns, associations, anomalies, and other valuable information from large datasets. It focuses on uncovering hidden insights and properties within the data.
Question 4
⇓
⇑
B. COUNTIF(A2:A11, ">10")
This formula counts the number of cells within the range A2:A11 that have values greater than 10.
Question 5
⇓
⇑
D. Data analysis tool:
Alteryx is primarily used as a data analysis tool. It provides a platform for data blending, preparation, and advanced analytics to help with data analysis tasks. While it includes data management and cleaning capabilities, its core function is to facilitate data analysis.

Study Business Data Analytics Online
Why Business Data Analytics?
Business Data Analytics is essential for informed decision-making in today's competitive landscape. It leverages advanced statistical analysis and data mining techniques to uncover valuable insights, patterns, and trends within large datasets. By interpreting this data, businesses can optimize strategies, improve operational efficiency, and gain a significant competitive advantage, leading to smarter, data-driven decisions.
Question 6
⇓
⇑
C. Physically administered questionnaire:
Physically administered questionnaires can potentially require significant data cleansing. They are more prone to errors such as illegible handwriting, missing information, and inconsistent responses, which can necessitate more extensive data cleaning efforts.
Online administered questionnaire:
Online questionnaires may require some data cleansing, but they often have built-in validation checks, which can help reduce errors and inconsistencies. The extent of data cleansing needed may not be significant if the questionnaire is well-designed.
Email administered questionnaire:
Similar to online questionnaires, email-administered questionnaires may include validation checks and may require some data cleansing, but the extent of cleansing needed would depend on the design and the data collected.
Question 7
⇓
⇑
B. HLOOKUP
HLOOKUP (Horizontal Lookup) is the function used to find data in Excel when you have unique codes or values in the top-most row of the dataset, and you want to retrieve corresponding data from a specific row in the same table. It is similar to VLOOKUP, which is used for vertical lookups, but HLOOKUP is specifically designed for horizontal searches.
Question 8
⇓
⇑
D. Data Safety
Data safety concerns, including security and privacy issues, are often significant factors that lead organizations to keep their data on-premises or opt for alternative solutions. These concerns may include data breaches, compliance with industry-specific regulations, or a lack of control over sensitive data in a cloud environment. Data safety is a primary consideration for many organizations when deciding whether or not to use cloud computing for their data management needs.
Question 9
⇓
⇑
C. Descriptive analytics
Descriptive analytics involves the examination of historical data to understand past trends, relationships, and patterns. Correlation analysis, in this context, helps in describing the relationship between two or more variables by measuring the degree to which they are related or co-vary. It doesn't make predictions (predictive analytics), provide recommendations (prescriptive analytics), or focus on discovering new insights (exploratory analytics); instead, it summarizes and describes the data.
Question 10
⇓
⇑
C. Comparison, composition, distribution, relationship
Comparison (Simplest): Comparing individual data points.
Composition: Visualizing data as parts of a whole.
Distribution: Representing the spread and pattern of data values.
Relationship (Most Complex): Exploring the connections and interactions between multiple variables.
Question 11
⇓
⇑
B. Developing initial hypothesis
During Phase 1, the primary focus is on understanding the problem and exploring the data rather than developing specific hypotheses. Hypothesis formulation often occurs in later stages when the data has been thoroughly understood and prepared.
Question 12
⇓
⇑
A. Only statement 1 is correct
Statement 1, "Variability is the evolving nature of data sources," is a correct description of the "Variability" aspect of big data. Variability in big data refers to the changing or evolving nature of data sources, which can include fluctuations in data formats, schemas, and data quality.
Statement 2, "Variability is the different types of data structures," is not an accurate description of the "Variability" aspect of big data. Instead, the different types of data structures are often associated with the "Variety" aspect of big data, not "Variability."
Question 13
⇓
⇑
B. R
R is considered by many to be one of the most important languages for Data Science. R is a programming language and environment that is widely used for data analysis, statistical modeling, and data visualization. It offers a rich ecosystem of libraries and packages tailored for data science and statistical analysis, making it a popular choice among data scientists and analysts.

Release of August 2023 Examination Results
Please access your portal to view your results. We wish you the best of luck
Question 14
⇓
⇑
A. Conceptual, logical, and physical
Conceptual Model: This is the high-level, abstract representation of the data without concern for how it will be physically implemented. It focuses on defining entities, their attributes, and the relationships between them.
Logical Model: The logical model refines the conceptual model by adding more detail and structure. It involves defining data structures, data elements, and the relationships more explicitly. However, it is still independent of any specific database management system.
Physical Model: The physical model is the concrete representation of the data designed for a specific database management system. It includes details like data types, indexing, and storage specifics.
Question 15
⇓
⇑
C. Visualisation
Visualization is the correct keyword for the definition of a graphical representation of a data set. Data visualization is the process of presenting data in a graphical or visual format to help people understand the patterns, trends, and insights in the data.
Question 16
⇓
⇑
A. Conceptual
The conceptual data model is a high-level representation of data that provides an overview of the system to be analyzed without delving into the technical details of how it will be implemented or analyzed. It focuses on defining entities, their attributes, and the relationships between them at an abstract level, allowing data analysts to understand the data structure and relationships without getting into specific implementation details.
Question 17
⇓
⇑
C. Association rules
Association rules are used to discover interesting relationships or patterns in large datasets. In this case, association rules can be applied to the data collected on visitors' viewing habits at the bank's website to identify pages commonly viewed during the same visit. This technique can help the bank understand the browsing patterns of their website visitors and optimize the layout or content of their website based on these insights.
Clustering : Clustering is a technique used for grouping similar data points together based on certain features or characteristics. It can be applied in various scenarios, such as customer segmentation, anomaly detection, or organizing web content. In the context of a bank's website, clustering might be used to group visitors with similar browsing patterns or interests.
Classification : Classification is used for categorizing data into predefined classes or labels. It is commonly used in tasks like email spam detection, sentiment analysis, or customer churn prediction. In the context of a bank's website, classification might be applied to classify visitors into different categories based on their behavior, such as loyal customers, potential leads, or one-time visitors.
Panel Analysis: Panel analysis typically involves tracking a group of subjects (or a panel) over time to observe changes or patterns. It is commonly used in market research, social science studies, and longitudinal studies. In the context of a bank's website, panel analysis might be used to study the long-term behavior and changes in behavior of a specific group of visitors over time, such as loyal customers or a focus group.
Question 18
⇓
⇑
C. Both statements 1 and 2 are true.
Statement 1 describes predictive data mining, which is focused on extracting data that may be helpful in determining an outcome or making predictions.
Statement 2 describes descriptive data mining, which is focused on summarizing and describing the data to inform users about the given outcome.
Both types of data mining are valid and serve different purposes in data analysis. Predictive data mining is about making predictions based on data, while descriptive data mining is about providing insights and summaries about the data itself.
Question 19
⇓
⇑
C. Data cleansing
Data cleansing involves cleaning and preprocessing the collected data to remove errors, inconsistencies, and inaccuracies, ensuring that the data is accurate, reliable, and ready for analysis. This step is crucial to ensure the quality of the data before any meaningful analysis or modeling can be performed.
Question 20
⇓
⇑
C. Develop data solutions that are optimized for performance and design applications
A data architect is primarily responsible for designing data systems and solutions that are efficient, effective, and well-suited for an organization's data needs. They focus on creating and managing data structures, databases, and systems that optimize data performance and ensure data is organized and accessible for various applications. While data architects work with data, their main role is in architecting and designing data solutions rather than utilizing data for business analysis (as described in options A and B) or evaluating data to reach logical conclusions (as described in option D).
Question 21
⇓
⇑
Comming Soon!
Question 22
⇓
⇑
Comming Soon!
Question 23
⇓
⇑
Comming Soon!
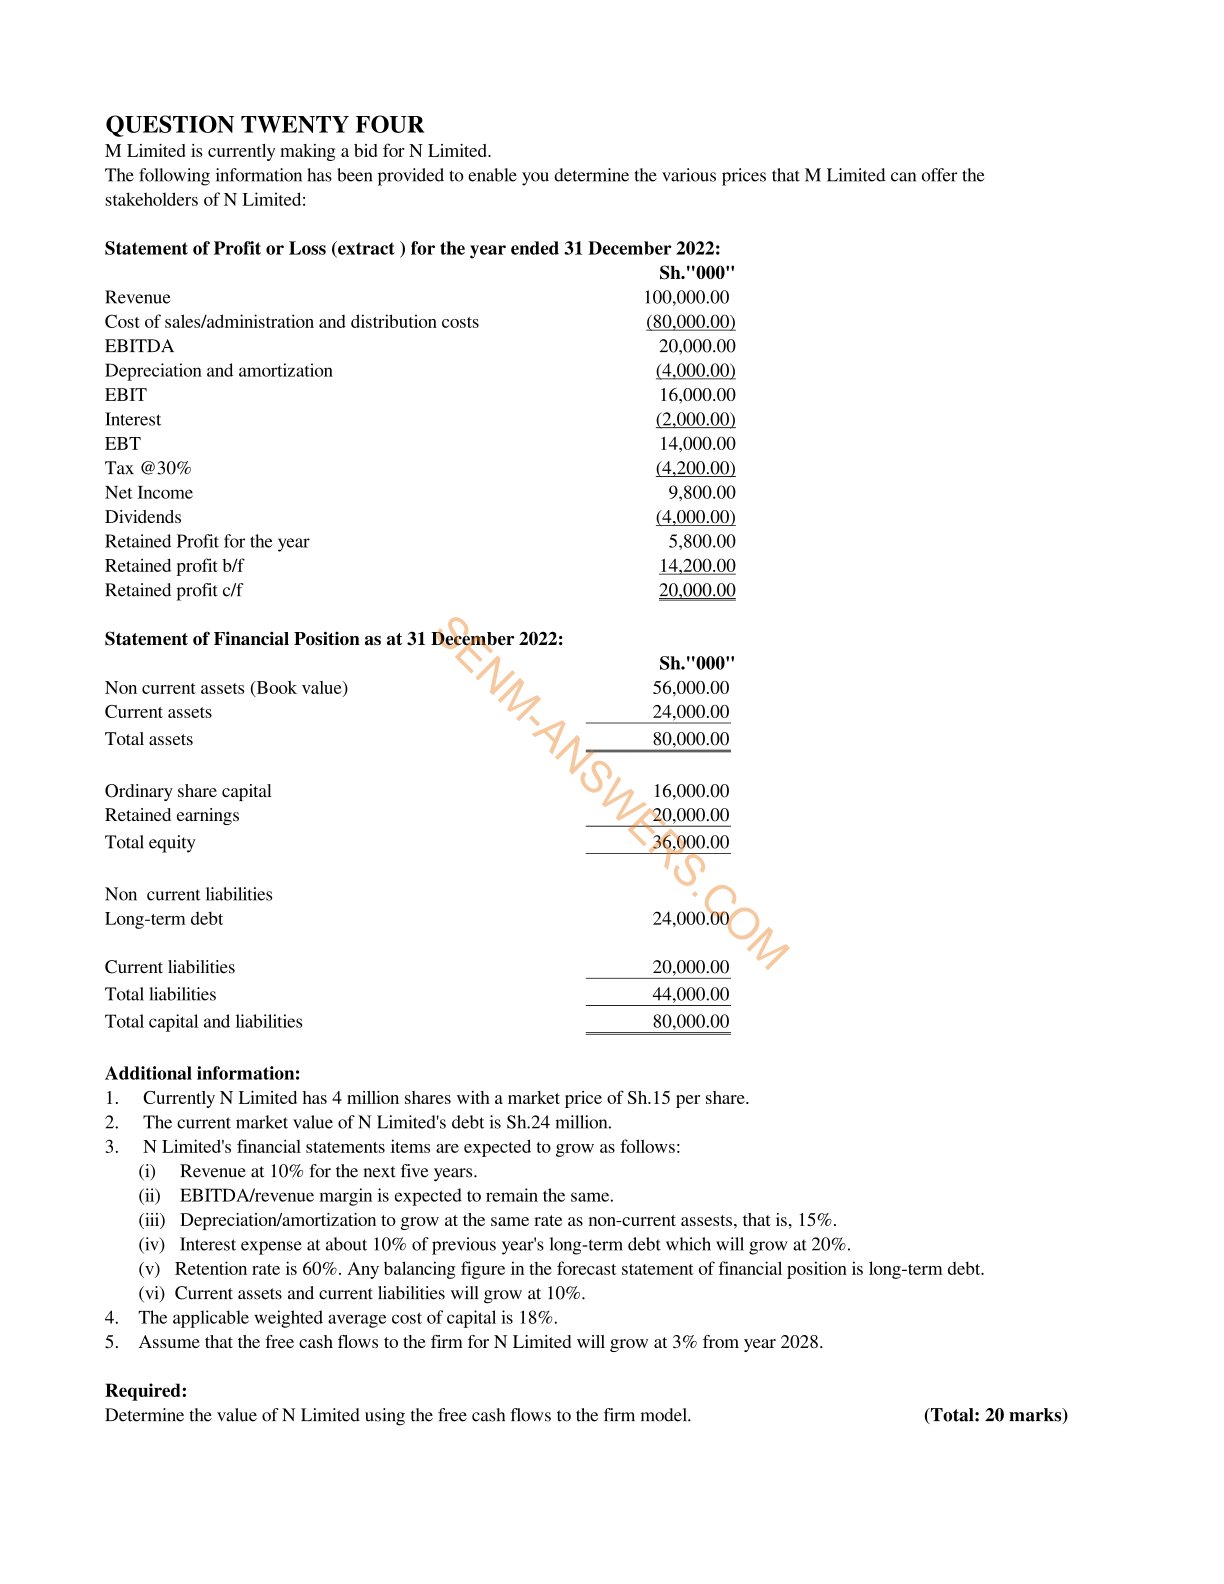
Question 24
⇓
⇑
Comming Soon!
Question 25
⇓
⇑
| Unadjusted Trial Balance | ||
| Debit | Credit | |
| Capital Revenue Trade payables Returns outwards Expected credit loss as at 1 January 2022 Discounts allowed Discounts received Purchases Returns inwards Distribution costs Drawings Rent, rates and insurance Heating and lighting Postage, stationery and telephone Advertising Salaries and wages Credit loss (bad debts) Cash in hand Cash at bank Inventory as at 1 January 2022 Trade receivables Property, equipment and furniture at cost Accummulated depreciation as at 31 December 2022 Depreciation expense for the year |
1,153,000 73,755,000 2,812,000 2,281,000 9,220,000.00 12,986,500.00 5,505,000.00 1,205,000.00 2,990,000.00 19,260,500.00 1,004,000.00 267,000.00 2,220,000.00 7,827,000.00 12,250,000.00 60,370,000.00 6,037,000.00 |
40,943,500.00 129,935,000.00 9,920,000.00 6,703,500.00 1,256,000.00 875,000.00 31,510,000.00 |
| 221,143,000.00 | 221,143,000.00 | |
| Adjustments | ||
| Debit | Credit | |
| Capital Revenue Trade payables Returns outwards Expected credit loss as at 1 January 2022 Discounts allowed Discounts received Purchases Returns inwards Distribution costs Drawings Rent, rates and insurance Heating and lighting Postage, stationery and telephone Advertising Salaries and wages Credit loss (bad debts) Cash in hand Cash at bank Inventory as at 1 January 2022 Trade receivables Property, equipment and furniture at cost Accummulated depreciation as at 31 December 2022 Depreciation expense for the year Insuarance prepayments Accrued heating and lighting Prepaid rates Bad debts Goods withdrawn |
450,000.00 680,000.00 220,000 2,640,000.00 120,000.00 560,000.00 2,717,500.00 609,000.00 |
2,640,000.00 609,000.00 3,277,500.00 220,000.00 120,000 680,000 450,000 |
| 7,996,500 | 7,996,500 | |
Adjusted Trial Balance: Add the relevant Adjustments to their respectives in the Unadjusted Trial Balance.
| Adjusted Trial Balance | ||
| Debit | Credit | |
| Capital Revenue Trade payables Returns outwards Expected credit loss as at 1 January 2022 Discounts allowed Discounts received Purchases Returns inwards Distribution costs Drawings Rent, rates and insurance Heating and lighting Postage, stationery and telephone Advertising Salaries and wages Credit loss (bad debts) Cash in hand Cash at bank Inventory as at 1 January 2022 Trade receivables Property, equipment and furniture at cost Accummulated depreciation as at 31 December 2022 Depreciation expense for the year Insuarance prepayments Accrued heating and lighting Prepaid rates Bad debts Goods withdrawn |
1,153,000.00 73,755,000.00 2,812,000.00 2,281,000.00 9,670,000.00 9,709,000.00 6,185,000.00 1,205,000.00 2,990,000.00 19,260,500.00 1,224,000.00 267,000.00 2,220,000.00 7,827,000.00 14,670,000.00 60,370,000.00 6,157,000.00 560,000.00 2,717,500.00 609,000.00 |
40,943,500.00 132,575,000.00 9,920,000.00 6,703,500.00 1,865,000.00 875,000.00 31,630,000.00 680,000 450,000 |
| 225,642,000.00 | 225,642,000.00 | |
| Statement of Profit or Loss | ||
| Revenue Return inwards Net Revenue Opening stock Purchases Return outwards Goods withdrawn Closing Inventory Total COS Gross profit Discounts received Discounts allowed Distribution costs Rent, rates and insurance Heating and lighting Postage, stationery and telephone Advertising Salaries and wages Credit loss (bad debts) 1,224,000.00 + 609,000 Depreciation expense for the year Operating profit |
132,575,000.00 (2,812,000.00) 129,763,000.00 (7,827,000.00) (73,755,000.00) 6,703,500.00 450,000 8,875,000.00 (65,553,500.00) 64,209,500.00 875,000.00 (1,153,000) (2,281,000.00) (9,709,000.00) (6,185,000.00) (1,205,000.00) (2,990,000.00) (19,260,500.00) (1,833,000.00) (6,157,000.00) 14,311,000.00 |
|
| Statement of Financial Position | |
|
PPE Receivables 14,670,000.00 - 1,865,000.00 Closing inventory Cash and cash equivalent Prepayments Total assets Share capital Retained earnings 14,311,000.00 - 9,670,000.00 Payables Accruals Total equity and liabilities |
28,740,000.00 14,670,000.00 8,875,000.00 2,487,000.00 3,277,500.00 56,184,500.00 40,943,500.00 4,641,000 9,920,000.00 680,000.00 56,184,500.00 |
Comments on:
CPA past papers with answers
BUSINESS DATA ANALYTICS- APRIL 2023.
Table of contents
Business Data Analytics - Past Papers
 |
Business Data Analytics Pilot 2022 |
 |
Business Data Analytics December 2022 |
 |
Business Data Analytics April 2023 |
Syllabus
-
1.0
Introduction to Excel
- Microsoft excel key features
- Spreadsheet Interface
- Excel Formulas and Functions
- Data Analysis Tools
- keyboard shortcuts in Excel
- Conducting data analysis using data tables, pivot tables and other common functions
- Improving Financial Models with Advanced Formulas and Functions
-
2.0
Introduction to data analytics
-
3.0
Core application of data analytics
- Financial Accounting And Reporting
- Statement of Profit or Loss
- Statement of Financial Position
- Statement of Cash Flows
- Common Size Financial Statement
- Cross-Sectional Analysis
- Trend Analysis
- Analyse financial statements using ratios
- Graphs and Chats
- Prepare forecast financial statements under specified assumptions
- Carry out sensitivity analysis and scenario analysis on the forecast financial statements
- Data visualization and dash boards for reporting
- Financial Management
- Time value of money analysis for different types of cash flows
- Loan amortization schedules
- Project evaluation techniques using net present value - (NPV), internal rate of return (IRR)
- Carry out sensitivity analysis and scenario analysis in project evaluation
- Data visualisation and dashboards in financial management projects
-
4.0
Application of data analytics in specialised areas
- Management accounting
- Estimate cost of products (goods and services) using high-low and regression analysis method
- Estimate price, revenue and profit margins
- Carry out break-even analysis
- Budget preparation and analysis (including variances)
- Carry out sensitivity analysis and scenario analysis and prepare flexible budgets
- Auditing
- Analysis of trends in key financial statements components
- Carry out 3-way order matching
- Fraud detection
- Test controls (specifically segregation of duties) by identifying combinations of users involved in processing transactions
- Carry out audit sampling from large data set
- Model review and validation issues
- Taxation and public financial management
- Compute tax payable for individuals and companies
- Prepare wear and tear deduction schedules
- Analyse public sector financial statements using analytical tools
- Budget preparation and analysis (including variances)
- Analysis of both public debt and revenue in both county and national government
- Data visualisation and reporting in the public sector
-
5.0
Emerging issues in data analytics