3.0. Core application of data analytics
Data analytics is indispensable in the fields of financial accounting and reporting as well as financial management. It empowers organizations to make data-driven decisions, enhance accuracy and compliance, detect fraud, control costs, manage risks, and optimize financial performance.
Table of Context:
3.1. Financial accounting and reporting
-
3.1.1. Prepare financial statements; statement of profit or loss, statement of financial position and statement of cash flow for companies and groups
3.1.1.1. Unlocking Profit Potential: How Data-Driven Analysis Transforms P&L Elements for Maximum Earnings and Cost Efficiency 3.1.1.2. The Impact of Data Analytics on the Statement of Financial Position -
3.1.1.3. Unlocking Financial Insights: How Data Analytics Enhances Cash Flow Interpretation for Stakeholders
3.1.2. Analyse financial statements using ratios,common size statements,trend-analysis and cross-sectional analysis,graphs and charts
3.1.3. Prepare forecast financial statements under specified assumptions
3.1.4 . Data visualization and dash boards for reporting
3.2. Financial Management
3.2.1. Time value of money analysis for different types of cash flows 3.2.2. Loan amortization schedules 3.2.3. Project evaluation techniques using net present value - (NPV), internal rate of return (IRR) 3.2.4. Carry out sensitivity analysis and scenario analysis in project evaluation 3.2.5. Data visualisation and dashboards
-
"Unlocking Insights"
Uncover the Power of Data Analytics
to Enhance Your Income Statement Analysis"

"Maximizing Profits"
Harnessing Data Analytics for
Optimal Income Statement Performance"
"Balancing Clues"
Every line item on a balance sheet holds a clue to a company's financial health.

"Financial Discovery"
Unveiling the hidden intricacies within a balance sheet is a journey of financial discovery empowered by data analytics.
"Cash Flow Analysis"
Optimizing liquidity and financial decision-making through data-driven insights.

"Efficiency Meets Insight"
Where operational efficiency aligns with data-driven insights.
"Cluster Analysis Insights"
Revealing hidden data patterns for informed decision-making.

"Empowering Decision-Making"
Harnessing insights for confident choices.
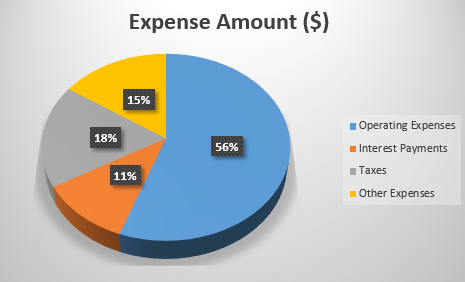
"Visualizing Data Slices"
Effortlessly understand complex data through pie chart visualization.

"Navigating Data Divisions"
Efficiently explore data segments with insightful pie charts.
Best Recommended Data Analytics Institutions
Unveiling Data Analytics' Pinnacle Potential

Unlocking Insights:
In today's data-driven world, data analytics stands as a beacon of knowledge, illuminating the vast potential hidden within data. This transformative field enables organizations to extract meaningful insights from massive datasets, uncovering patterns, trends, and correlations that might otherwise remain obscured. By leveraging data analytics, businesses can make data-driven decisions, optimize processes, and gain a competitive edge. It's the key to unlocking insights that drive innovation, enhance customer experiences, and shape the future of industries.
Innovating Financial Analysis:
One of the core applications of data analytics is in the realm of financial analysis and reporting. With data analytics, financial professionals can dissect complex financial data, such as income statements, balance sheets, and cash flow statements. This technology empowers them to identify trends, evaluate performance, and detect anomalies with precision. By harnessing data analytics, financial management becomes more efficient, strategic, and agile, leading to better financial health and sustainable growth.

Revolutionizing Decision-Making:
Data analytics extends its influence far beyond financial domains, revolutionizing decision-making processes across industries. From healthcare to marketing, logistics to manufacturing, data analytics helps organizations make informed choices, reduce risks, and seize opportunities. Whether it's predicting customer preferences, optimizing supply chains, or enhancing product quality, data analytics plays a pivotal role in shaping strategies, fostering innovation, and ensuring businesses stay ahead in an ever-evolving landscape. It's a transformative force that empowers decision-makers with the knowledge needed to thrive in the data age
.Business Data Analytics
Table of contents
Syllabus
-
1.0
Introduction to Excel
- Microsoft excel key features
- Spreadsheet Interface
- Excel Formulas and Functions
- Data Analysis Tools
- keyboard shortcuts in Excel
- Conducting data analysis using data tables, pivot tables and other common functions
- Improving Financial Models with Advanced Formulas and Functions
-
2.0
Introduction to data analytics
-
3.0
Core application of data analytics
- Financial Accounting And Reporting
- Statement of Profit or Loss
- Statement of Financial Position
- Statement of Cash Flows
- Common Size Financial Statement
- Cross-Sectional Analysis
- Trend Analysis
- Analyse financial statements using ratios
- Graphs and Chats
- Prepare forecast financial statements under specified assumptions
- Carry out sensitivity analysis and scenario analysis on the forecast financial statements
- Data visualization and dash boards for reporting
- Financial Management
- Time value of money analysis for different types of cash flows
- Loan amortization schedules
- Project evaluation techniques using net present value - (NPV), internal rate of return (IRR)
- Carry out sensitivity analysis and scenario analysis in project evaluation
- Data visualisation and dashboards in financial management projects
-
4.0
Application of data analytics in specialised areas
- Management accounting
- Estimate cost of products (goods and services) using high-low and regression analysis method
- Estimate price, revenue and profit margins
- Carry out break-even analysis
- Budget preparation and analysis (including variances)
- Carry out sensitivity analysis and scenario analysis and prepare flexible budgets
- Auditing
- Analysis of trends in key financial statements components
- Carry out 3-way order matching
- Fraud detection
- Test controls (specifically segregation of duties) by identifying combinations of users involved in processing transactions
- Carry out audit sampling from large data set
- Model review and validation issues
- Taxation and public financial management
- Compute tax payable for individuals and companies
- Prepare wear and tear deduction schedules
- Analyse public sector financial statements using analytical tools
- Budget preparation and analysis (including variances)
- Analysis of both public debt and revenue in both county and national government
- Data visualisation and reporting in the public sector
-
5.0
Emerging issues in data analytics


