

Question 1
⇓
⇑
C. A conceptual representation of data objects provides the correct definition of a data model.
A data model is a conceptual representation of how data is structured, organized, and related to each other. It defines the entities (data objects), their attributes, and the relationships between them. Data models are used in database design and information systems to help understand, plan, and implement the structure of data within an organization. While data models may be represented visually or graphically, the essence of a data model is its conceptual representation, making option C the most accurate definition.

In an era of rapid globalization and technological advancements, Kasneb's cutting-edge syllabuses are designed to meet the dynamic demands of today's market. Our competency-based approach will boost your global competitiveness and propel you to the pinnacle of success. Join us on the journey to the top!
Question 2
⇓
⇑
C. Inventory and resources available
"Inventory and resources available," is not typically part of the initial "understanding the business" phase in the CRISP-DM methodology. The inventorying of data and assessing resources is often examined in later stages of the process.
Question 3
⇓
⇑
A. Inference
The most common goal of statistical modeling is inference. Statistical inference involves drawing conclusions or making predictions about a population based on a sample of data from that population. Statistical models are used to estimate relationships between variables and to make predictions or infer properties of the population from which the sample was drawn. Descriptive analysis (option B) involves summarizing and describing the main features of a dataset. Sub-setting (option C) involves dividing the dataset into smaller subsets based on certain criteria. Risk analysis (option D) involves assessing the probability and impact of uncertain events. While all these goals are important, inference is the primary goal of statistical modeling.
Question 4
⇓
⇑
C. Knowledge
A collection of interesting and useful patterns in a database is typically referred to as "knowledge." Knowledge in the context of data mining and data analysis represents the insights, information, or patterns that have been discovered in the data, which can be used to make informed decisions, improve processes, or gain a deeper understanding of the underlying data. While "data set" (option A) represents the raw data, "information" (option B) is typically the processed or organized data, and "analytics" (option D) refers to the methods and techniques used to analyze the data. Knowledge, on the other hand, represents the valuable findings and insights derived from data analysis.
Question 5
⇓
⇑
C. Data cleaning activities
A data cleaning report typically includes the following:
A. Data structure: The report may include information about the structure of the data, such as the format of the data, the variables or columns, and any changes made to the data structure during cleaning.
B. Data content: The report should describe the content of the data, including any anomalies, missing values, or outliers that were identified during the data cleaning process.
C. Data cleaning activities: The report should detail the specific cleaning activities that were performed, such as handling missing data, correcting errors, and removing duplicates. It should also explain the methods used for each activity.
D. Data models: While data cleaning reports primarily focus on the data cleaning process, they may also touch on data models if data cleaning was done in preparation for a specific data modeling or analysis project. However, the main emphasis in a data cleaning report is typically on the cleaning activities and the quality of the data.
So, all of these elements can be included in a data cleaning report, but the level of detail and emphasis may vary depending on the specific goals of the report and the audience it is intended for.
Due to its great priority, we shall choose option C.

Study Business Data Analytics Online
Why Business Data Analytics?
Business Data Analytics is essential for informed decision-making in today's competitive landscape. It leverages advanced statistical analysis and data mining techniques to uncover valuable insights, patterns, and trends within large datasets. By interpreting this data, businesses can optimize strategies, improve operational efficiency, and gain a significant competitive advantage, leading to smarter, data-driven decisions.
Question 6
⇓
⇑
B. Control + V.
Control + C (Option C) is used to copy data.
Control + F (Option A) is used for the "Find" function.
Control + U (Option D) is used to underline text.
Question 7
⇓
⇑
A. Statements (i) and (ii) are correct.
(i) STDEV.P - Calculates standard deviation based on the entire population given as arguments (ignores logical values and text)
(ii) STDEV.S - Estimates standard deviation based on a sample (ignores logical values and text in the sample).
(iii) STDEVA - Estimates standard deviation based on a sample including legical values and text. Text and the logical value FALSE have the value the legical value TRUE has the value.
Question 8
⇓
⇑
C. VLOOKUP .
Array functions in Excel are functions that can perform calculations on multiple values or an array of values and return a single result. Examples of array functions include MMULT (matrix multiplication) and TRANSPOSE (which can operate on arrays). VLOOKUP, on the other hand, is not considered an array function; it is used to search for a value in a specific column and return a corresponding value from another column in a table.
Question 9
⇓
⇑
C. Dataframe
In the context of SQL tables or spreadsheet data representation, a "dataframe" is the basic data structure. Dataframes are commonly used in data manipulation and analysis tools such as Python's pandas library or R for data analysis. They are a two-dimensional, tabular data structure with rows and columns, which closely resembles the structure of data in SQL tables and spreadsheet software like Microsoft Excel or Google Sheets.
Question 10
⇓
⇑
D. Terabytes
"Velocity" in the context of big data refers to the speed at which data is generated, collected, and processed. It is about the fast-paced nature of data, particularly in real-time or streaming scenarios. The components associated with velocity typically involve processes, streams, and real-time data. Terabytes, on the other hand, refer to the volume or size of data and are more closely related to the "Volume" aspect of big data, not "Velocity."
Question 11
⇓
⇑
A. Veracity
The "Vs" of data in the context of big data include Volume, Velocity, Variety, Veracity, and Value. Among these, "Veracity" is the one that specifically pertains to the authenticity, trustworthiness, and originality of data. It deals with data quality, accuracy, and the assurance that data is reliable and free from errors or inconsistencies.
Volume: Refers to the sheer amount of data. Big data often involves handling and processing massive volumes of data, which can be too large for traditional data storage and processing systems.
Velocity: Relates to the speed at which data is generated, collected, and processed. With the advent of real-time data streams, big data systems need to handle data at high speeds.
Variety: Encompasses the diversity of data types and sources. Big data is not limited to structured data; it includes unstructured and semi-structured data from various sources, such as text, images, videos, and sensor data.
Value: Represents the ultimate goal of big data analysis, which is to derive valuable insights and knowledge from the data. The value comes from extracting meaningful information and making data-driven decisions that benefit organizations or individuals.
Question 12
⇓
⇑
D. Only statements (i) and (ii) are correct.
(i) Descriptive Analytics: Provides historical data and information. It deals with the analysis of past events and tries to understand the reasons behind the occurrences.
(ii) Prescriptive Analytics: Provides data and information for decision-making. It suggests the best course of action to take based on the available data.
(iii) Predictive Analytics: Predictive analytics focuses on predicting future outcomes based on historical data. It does not primarily provide data and information to explain deviation from expected; rather, it forecasts future trends and behaviors.
Question 13
⇓
⇑
A. Prescriptive analytics
Prescriptive analytics (option A) ranks highest among the data analytics tools in terms of complexity and the value it provides.
Descriptive Analytics (option C) provides a summary of historical data, describing what has happened in the past. It's essentially about understanding past events and data patterns.
Predictive Analytics (option B) goes a step further by using historical data to make predictions about future events or trends. It aims to answer questions like "What is likely to happen next?"
Prescriptive Analytics (option A) is the most advanced. It not only predicts future outcomes but also provides recommendations on what actions to take to achieve a specific outcome. It answers questions like "What should we do to make a desired future outcome happen?"
Summative analysis (option D) is a collaborative analytical technique that facilitates the convergence of a diverse group of researchers, academics, and scientists in joint analysis sessions. These sessions aim to collectively delve into the nuances of textual data.
"Summative analytics" is not a standard term in the context of data analytics, so it's not typically used to rank these analytics methods.

Release of August 2023 Examination Results
Please access your portal to view your results. We wish you the best of luck
Question 14
⇓
⇑
D. Filling in for missing data
Filling in for missing data is not typically considered a data cleaning strategy. Data cleaning strategies usually involve removing incorrect data, removing duplicate data, and fixing data with structural errors to ensure the data's accuracy and reliability. Filling in missing data is more related to data imputation techniques, which can be a part of data preprocessing but is not strictly a data cleaning strategy.
Question 15
⇓
⇑
A. Data Stage
IBM DataStage is a popular ETL (Extract, Transform, Load) tool that data analysts often use to clean, transform, and prepare data for analysis. Data analysts can also use SQL for data cleaning tasks, but DataStage is specifically designed for ETL processes, making it a common choice for cleaning and preparing data for analysis. Tableau and MicroStrategy are primarily used for data visualization and business intelligence, not for data cleaning.
Question 16
⇓
⇑
D. 4, 2, 3, and 1
The purpose: Before creating a data visualization, you should establish the purpose or objective of the visualization. What message or insight are you trying to convey?
The content: Once the purpose is clear, you can determine what data and information are necessary to support that purpose. This step involves selecting the right data and content to include.
The structure: With the content in mind, you design the structure of the visualization, considering how to represent the data effectively. This includes choosing the type of chart or graph, arranging the elements, and deciding on layout.
The format: Finally, you focus on the format, which involves the aesthetics and visual design of the visualization, including colors, fonts, and other stylistic elements.
Question 17
⇓
⇑
B. Stacked Bar Chart
A stacked bar chart is often a more effective choice for presenting the relationship between variables in data visualization, particularly when you want to show how different components contribute to a whole or how data points compare within different categories. Stacked bar charts allow you to visualize the composition and distribution of data across categories, making it easier to observe the relationships between variables. It's a better choice for this purpose compared to other options:
An "Exploded Pie Chart" (A) is less effective as it's generally not recommended due to difficulties in interpreting the size of individual segments and comparing them accurately.
A "Progress Line graph" (C) is used to show progress or trends over time, making it suitable for different purposes.
A "Radar Chart" (D) is useful for displaying multivariate data, often in a radar or spider web-like format, but it may not be the best choice for showing relationships between variables unless you have specific use cases.
Question 18
⇓
⇑
C. The method of presenting a part-to-whole relationship of data and information
Composition in data visualization refers to the technique of presenting a part-to-whole relationship within a dataset. It illustrates how individual data points contribute to the whole dataset, showing proportions and percentages. Common types of visualizations used for composition include pie charts, stacked bar charts, and treemaps.
Question 19
⇓
⇑
D. Chief Executive Officer
The Chief Executive Officer (CEO) is typically not directly involved in the day-to-day implementation of data protection laws in an organization. While the CEO may have a high-level understanding of data protection and may set the overall tone for data governance and compliance, the specific responsibilities for implementing data protection laws often fall on other roles within the organization.
The other roles mentioned—Chief Risk Officer, Chief Legal Officer, and Chief Information Officer—have more direct involvement in implementing and overseeing data protection laws and compliance within the organization:
The Chief Risk Officer is responsible for assessing and mitigating various risks, including those related to data security and compliance with data protection laws.
The Chief Legal Officer is responsible for legal matters within the organization, including ensuring that the company complies with data protection laws and regulations.
The Chief Information Officer is typically responsible for the organization's IT infrastructure, including data security and data protection measures.
Question 20
⇓
⇑
C. Data Traceability
Under data protection laws, the requirement for organizations to demonstrate they know the data they hold, where it is stored, and who it is shared with is referred to as "Data Traceability". Data traceability involves the ability to track the movement of data throughout its lifecycle within an organization, ensuring transparency and accountability in data processing activities.
Data Portability: Data portability is a different concept related to data protection laws. It refers to the right of individuals to obtain and reuse their personal data for their own purposes across different services. Organizations are typically required to provide mechanisms for individuals to access and transfer their data between services.
Data Inventory: Data inventory is the process of cataloging and documenting the data assets within an organization. It involves creating a comprehensive list of the data held by an organization, where it's stored, how it's used, and its various attributes. While related to data protection, it doesn't specifically address the aspect of demonstrating knowledge about data sharing.
Data Management: Data management encompasses a broad set of practices and processes for acquiring, organizing, storing, and maintaining data throughout its lifecycle. Data management is crucial for ensuring data quality, security, and compliance but may not specifically address the requirement of demonstrating knowledge about data sharing, as described in the question.
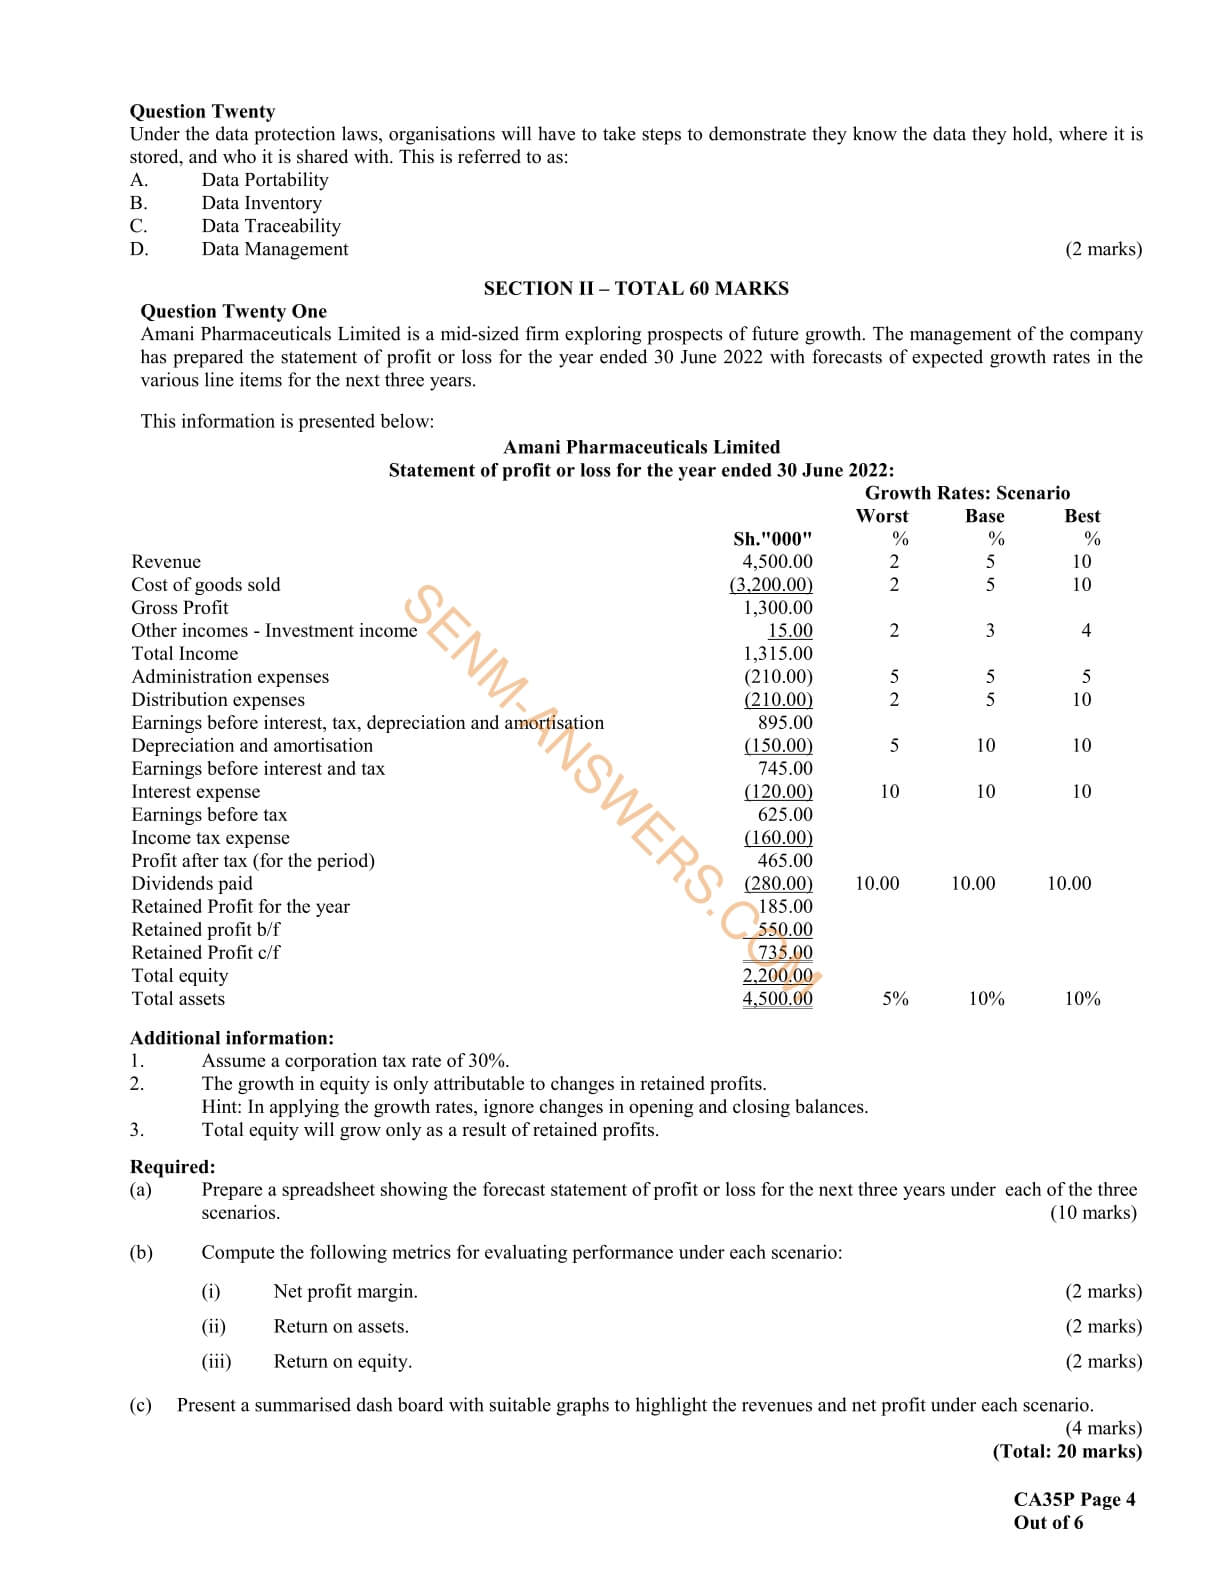
Question 21
⇓
⇑
Comming Soon!
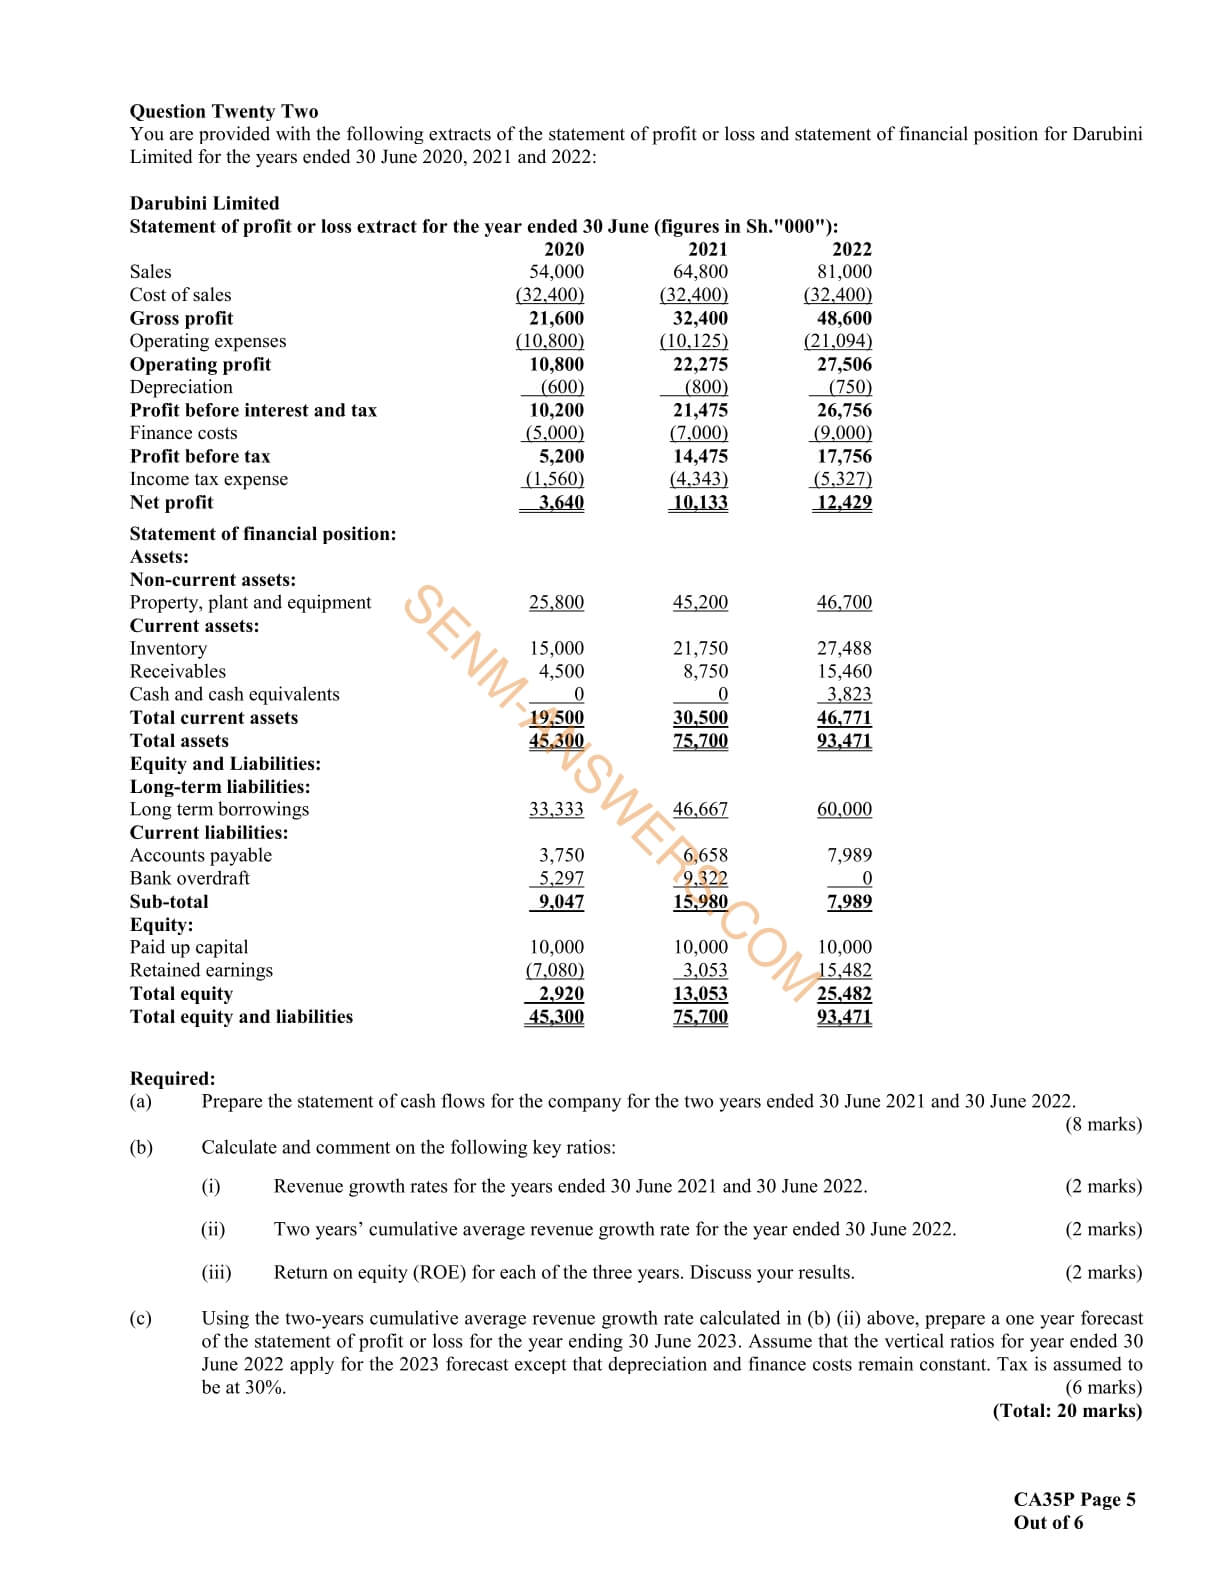
Question 22
⇓
⇑
Comming Soon!
Question 23
⇓
⇑
Comming Soon!
Question 24
⇓
⇑
Comming Soon!
Question 25
⇓
⇑
Comming Soon!
Comments on:
CPA past papers with answers
BUSINESS DATA ANALYTICS- DECEMBER PILOT 2022.
Table of contents
Business Data Analytics - Past Papers
 |
Business Data Analytics Pilot 2022 |
 |
Business Data Analytics December 2022 |
 |
Business Data Analytics April 2023 |
Syllabus
-
1.0
Introduction to Excel
- Microsoft excel key features
- Spreadsheet Interface
- Excel Formulas and Functions
- Data Analysis Tools
- keyboard shortcuts in Excel
- Conducting data analysis using data tables, pivot tables and other common functions
- Improving Financial Models with Advanced Formulas and Functions
-
2.0
Introduction to data analytics
-
3.0
Core application of data analytics
- Financial Accounting And Reporting
- Statement of Profit or Loss
- Statement of Financial Position
- Statement of Cash Flows
- Common Size Financial Statement
- Cross-Sectional Analysis
- Trend Analysis
- Analyse financial statements using ratios
- Graphs and Chats
- Prepare forecast financial statements under specified assumptions
- Carry out sensitivity analysis and scenario analysis on the forecast financial statements
- Data visualization and dash boards for reporting
- Financial Management
- Time value of money analysis for different types of cash flows
- Loan amortization schedules
- Project evaluation techniques using net present value - (NPV), internal rate of return (IRR)
- Carry out sensitivity analysis and scenario analysis in project evaluation
- Data visualisation and dashboards in financial management projects
-
4.0
Application of data analytics in specialised areas
- Management accounting
- Estimate cost of products (goods and services) using high-low and regression analysis method
- Estimate price, revenue and profit margins
- Carry out break-even analysis
- Budget preparation and analysis (including variances)
- Carry out sensitivity analysis and scenario analysis and prepare flexible budgets
- Auditing
- Analysis of trends in key financial statements components
- Carry out 3-way order matching
- Fraud detection
- Test controls (specifically segregation of duties) by identifying combinations of users involved in processing transactions
- Carry out audit sampling from large data set
- Model review and validation issues
- Taxation and public financial management
- Compute tax payable for individuals and companies
- Prepare wear and tear deduction schedules
- Analyse public sector financial statements using analytical tools
- Budget preparation and analysis (including variances)
- Analysis of both public debt and revenue in both county and national government
- Data visualisation and reporting in the public sector
-
5.0
Emerging issues in data analytics