Guaranteed

95.5% Pass Rate

CPA
Foundation Leval
Quantitative Analysis May 2018
Suggested solutions

Quantitative analysis
Revision Kit

QUESTION 1(a)

Q Enumerate four assumptions that are implied in the application of the linear programming model. (4 marks)
A

Solution


Assumptions that are implied in the application of the linear programming model

➢ For the planning period, only one decision is needed.

➢ There is a linear relationship between the variables and the resources available.

➢ It is based on the assumption that the decision variables are continuous.

➢ All variables can only have non-negative values.

➢ No matter the volume of production or sales, it is assumed that a product's profit contribution will remain constant.

➢ The decision maker is assumed to be absolutely certain.


QUESTION 1(b)

Q (i) The number of electric components that would maximise profit. (4 marks)

(ii) The maximum profit. (2 marks)

(iii) The maximum total revenue. (2 marks)
A

Solution


Total profit (TP) = Total revenue (TR) - Total cost (TC)

Total Revenue (TR) = pq.

(100 - 5q)q

TR = 100q - 5q2

TC = q2 + 4q + 300

TP = (100q - 5q2) - (q2 + 4q + 300)

-6q2 + 96q - 300

At maximum profit

Margin profit(MP) = 0

MP = dtp / dq

-12q = -96

q = -96 / -12 = 8 units

Hence, 8 electric components should be produced The maximum profit: so as to maximize profit

(ii) The maximum profit

TP(Sh000) - 6q2 + 96q - 300

q = 8 units

TP(Sh000) = -6(8)² + 96(8) - 300

-384 + 768 - 300 = 84

Therefore, Maximum profit Sh.84,000

(iii) The maximum total revenue

TR(Sh000) = 100q - 5q2

q = 8 units

TR(Sh000) = 100(8) - 5(8)2

800 - 320 = 480

Therefore Maximum total revenue shs. 480,000


QUESTION 1(c)

Q (i) The technical coefficient matrix. (l mark)
(ii) The total output of each department given that the LeontiePs inverse matrix is as provided below:(3 marks)
(iii) The change in the total output of the construction department, given that the final demand of steel department decreases by 2 million units and that of motor vehicles department increases by 10 million units whereas that of the construction department does not change. (4 marks)
A

Solution


S = Steel dept
M = M vehicles
C = Costruction department

To
From
0
S
M
C
[
S
0.2
0.2
0.3
M
0.3
0.4
0.4
C
0.4
0.2
0.1
]


(ii) The total output of each department given that the LeontiePs inverse matrix is as provided below:

Vector matrix of final demand
[
20
50
30
]


Hence total output of each dept

1

0.192
[
0.46
0.43
0.30
0.24
0.60
0.24
0.26
0.41
0.42
]
x
[
20
50
30
]


1

0.192
[
0.46(20)
0.43(20)
0.30(20)
0.24(50)
0.60(50)
0.24(50)
0.26(30)
0.41(30)
0.42(30)
]


1

0.192
[
29
50.9
30.6
]


[
151.042
265.104
159.375
]


Hence, the total output in millions" of each department is 151.042, 265.104 and 159.375 for steel (a) motor vehicle (b) and construction (c) respectively.

(iii) The change in the total output of the construction department.

The vector matrix of final demand after incorporating changes:

S
M
C
[
18
60
30
]


The total output of each department after changes

1

0.192
[
0.46
0.43
0.30
0.24
0.60
0.24
0.26
0.41
0.42
]
x
[
18
60
30
]


1

0.192
[
0.46(18)
0.43(18)
0.30(18)
0.24(60)
0.60(60)
0.24(60)
0.26(30)
0.41(30)
0.42(30)
]


1

0.192
[
30.48
56.04
32.40
]


S
M
C
[
158.750
291.875
168.750
]


168.75 - 159.375 = 9.375 Million


QUESTION 2(a)

Q (i) Distinguish between a "single server queuing model" and a "multiple server queuing model" (2 marks)
(ii) Highlight two assumptions of the queuing theory. (2 marks)
A

Solution


Distinguishing between a "single server" queuing model and a "multiple server" queuing model

In a single server queuing model, customers can only be served through one channel. whereas in a multiple server queuing model, there are multiple channels to provide services to customers.

(ii) Highlight assumptions of the queuing theory

➢ Although the average number of arrivals varies over time, arrivals are independent of this.

➢ There is no balking as customers arrive; everyone waits to be served regardless of how long the line is.

➢ The average service rate exceeds the average arrival rate.

➢ Although service times differ from one customer to the next and are not dependent on one another, their average rate is known.

➢ Arrivals come from an infinite or very large population and are described by a poison probability distribution.

➢ The negative exponential probability distribution describes how service times occur.


QUESTION 2(b)

Q Outline three advantages and three disadvantages of the simulation model as used in quantitative analysis. (6 marks)
A

Solution


Advantages simulation model

➢ It is flexible and generally easy to understand.
➢ Most quantitative analysis models do not permit the addition of real-world problems, but this one does.
➢ Enables us to examine the interaction between several elements or variables to identify which ones are crucial.
➢ It allows what if, ands, or maybes types of inquiries.
➢ Can be used to analyze complicated real-world problems that conventional quantitative analysis models are unable to solve.
➢ The system in the real world is unaffected by it.

Disadvantages of simulation model

➢ It can be highly expensive to purchase good simulation models for complex situations.
➢ The simulation model does not produce or generate solutions on its own. Therefore, they must create all of the requirements and restrictions for the solutions they want to look at.
➢ With repeated trials, the trial-and-error method can produce various results. Consequently, it is unable to produce ideal solutions to problems as other quantitative analysis techniques such as linear programming, pert, or EOQ do.
➢ Its solutions and interferences frequently cannot be applied to other issues. As a result, each simulation model is distinct.


QUESTION 2(c)

Q A 95 per cent confidence interval of the population mean height of the seedlings. (4 marks)
A

Solution


μ = x̄+ tα / 2,n-1 x δ / √n

Since the population standard deviation (δ) is not known, it can be estimated from the sample as

δ
=
Σ(x - x̄)²

n - 1


x̄ = ∑x / n = 584 / 9 = 64.8889

x (x - x̄)2
64 0.7901
62 8.3457
65 0.0123
63 3.5679
68 9.6789
69 16.9011
65 0.0123
63 3.5679
65 0.0123
∑x = 584 42.8885


δ
=
42.8885

9 - 1


= 2.3154

α = 1 - 0.95 = 0.05

tα/2,n-1 = t0.025,8

t0.025,8 = 2.306

μ = x̄ ± tα / 2,n-1 x δ/√n

μ = 64.8889 ± 2.306 x 2.3154/√9

μ = 64.8889 ± 1.7798


QUESTION 2(d)

Q The quantities of product "Nguzo" that should be produced by factories Xl and X2 respectively in order to minimise cost. (6 marks)
A

Solution


ac/aq1 = 4q1 + q2

4q1 + q2 = 0 ...... i

ac / aq2 = q1 + 2q2

1(4q1 + q2) = 0 x 1 ...... i
4(q1 + 2q2) = 0 x 4 ...... ii

4q1 + q2 = 0
4q1 + 8q2 = 0

7q2 = 0

q2 = 0 / 7 = 0 units

4q1 + 0 = 0

q1 = 0 units

Hence, the company should produce zero(0) units the product each of the two fractions x1 and x2, so as to minimize cost .


QUESTION 3(a)

Q (i) "Type I error" and "type II error". (2 marks)
(ii) "One tailed test" and "two tailed test" (2 marks)
A

Solution


(i) Type I error and" Type II error"

Type I error occurs when the decision is to reject a null hypothesis (ho) is true. On the other hand, type II error occurs when the decision is not to reject the null hypothesis when, in fact, the null hypothesis is false.

(ii) One failed test and two failed test"

One failed test: It is a test in which the alternative hypothesis (H) is either a less than statement or greater than statement, if t is a less than statement, then it is known as a left-tailored test (or lower-failed test). However, it is a greater than statement, then it is called right-tailed test or upper failed test.
Two tailed test: It is a test in which the alternative hypothesis (H) is a "not equal" statement.


QUESTION 3(b)

Q Test at a 5 per cent level of significance, whether there is a significant difference in the monthly mean sales of the two outlets, (6 marks)
A

Solution


Formulating the hypothesis:

HO : μl - 2 - 0; i.e there is no significant difference in the monthly mean sales of the two outlets A and B

Hl : ul - u2 ≠01 i.e there is significant difference in the monthly measures of the two outlets A and B

The test statistic to be used in this case, it is a z-test for two sample means;

Where:

X̄₁ = 795 (sh000)
X̄₂ = 810 (sh000)
δ₁ = 50 (sh000)
δ₂ = 70 (sh000)
n₁ = 200
n₂ = 175

z
=
(795 - 810) - 0

(50)2 / 200 + (70)2 / 175


-15 / √40.5 = -2.357

α = 5% = 0.05

Z α/2 = Z0.025

Z0.025 = + 1.96.

Illustration:


Decision
The observed Z = -2.357 is less than the critical Z = -1.96, and lies in the rejection region for Ho.The decision is therefore to reject Ho

Conclusion
There is significant difference in the monthly mean sales of the two outlets: A and B.


QUESTION 3(c)

Q (i). The payoff table of the company.(6 marks)
(ii). The type of pen to produce using the maximin criterion. (l mark)
(iii). The type of pen to produce using the maximax criterion.(l mark)
(iv). The type of pen to produce using the minimax regret criterion. (2 marks)
A

Solution


Contribution = Sp - Vc

Type of pen Contribution per unit
Sh
P1 200 - 100 = 100
P2 200 - 80 = 120
P3 200 - 60 = 140


π = Total contribution - Total fixed cost

Pay off table
Law(L) Moderate(M) High(H)
Decision alternative (250,000) (1,000,000) (1,500,000)
P1(250,000) 23,000,000 -50,000,000 -100,000,000
P2(100,000) 26,800,000 116,800,000 60,000
P3(1,500,000) 29,000,000 134,000,000 204,000,000


W1

(P1L)(250,000 × 100) - 2,000,000 = 23,000,000
(P1M)(250,000 × 100 - 2,000,000) - (750,000 × 100 - 2,000,000) = -50,000,000
(PH)(250,000 × 100 - 2,000,000) - (1,250,000 × 100 - 2,000,0000) = -100,000,000

(P2L) (250,000 × 120) - 3,200,000 = 26,800,000
(P2 M) (1,000,000 × 120) - 3,200,000 = 116,800,000
(P2H) [(1,000,000 × 120) - 3,200,000] - [500,000 × 120 - 3,200,000] = 60,000,000

(P3L)(250,000 x 140 - 6,000,000) = 29,000,000
(P3M)(1,000,000 x 140 - 6,000,000) = 134,000,000
(P3H) (1,500,000 × 140 - 6,000,000) = 204,000,000

(ii) The type of pen to produce using the maximum criterion

The minimum of each row;

P1 = Sh-100,000,000
P2 = Sh.26,800,000
P3 = Sh.29,000,000

Therefore the maximum -Sh. 29,000,000 for P3 Hence, the company should produce type 3 pen so as to maximize profit.


(iii) The type of pen to produce using the maximax criterion:

The maximum of each row:

P1 = Sh 23,000,000
P2 = Sh.116,800,000
P3 = sh.204,000,000

Therefore the maximum of maximum is Sh 204,000,000; for P3

Hence, the company should produce type 3 pen so as to maximize profit


(iv) The type of pen to produce using the minimax regret criterion

Constructing an opportunity loss table by deducting each payoff under each of the states of nature that is demand, from the maximum payoff under each of the given states of nature or demand. This gives an opportunity loss table as shown below

DEMAND
Low Moderate High
Decision alternative P1 6,000,000 184,000,000 304,000,000
P2 2,200,000 17,200,000 144,000,000
P3 0 0 0


The maximum request under each decision alternative

P1 = Sh. 304,000,000
P2 = Sh. 144,000,000
P3 = Sh. 0

Based on the minimax regret criterion, therefore the company should produce type3 pen so as to minimize the opportunity loss i.e maximum regret under the various states of demand.


QUESTION 4(a)

Q (i) Mixed strategy. ( l mark)

(ii) Value of the game. (1 mark)
A

Solution


1. Mixed strategy
A mixed strategy exists in a strategic game, when a player decides on a course of action based on a probability distribution rather than making a single, fixed decision.

2. Value of the game
Refers to the game's expected value once each player has utilized their optimal strategies.


QUESTION 4(b)

Q The coefficient of correlation. Interpret your result. (8 marks)
A

Solution


r
=
n∑xy - ∑x ∑y

[n∑X2 - (∑x)2][n∑y2 - (∑y2)]


Where;
x = Intelligence test score(%)
y = Weekly sales(sh.000)

X Y
000
X2 Y2 XY
40 50 1,600 2,500 2,000
70 120 4,900 14,400 8,400
50 80 2,500 6,400 4,000
60 100 3,600 10,000 6,000
80 80 6,400 6,400 6,400
50 50 2,500 2,500 2,500
90 110 8,100 12,100 9,900
40 60 1,600 3,600 2,400
60 90 3,600 8,100 5,400
60 60 3,600 3,600 3,600
∑x=600 ∑y=800 ∑x2 38,400 ∑y2 69,600 ∑xy=50,600


n = 10

r
=
10x50,600 - 600x800

[10x38,400 - 6002][10x69,600 - 8002]


= 0.709

Interpretation

The correlation coefficient found above demonstrates a reasonably strong position association between the intelligence test result and the weekly sales made by the sales ladies.


QUESTION 4(c)

Q (i). A linear programming model of the firm. (4 marks)

(ii). The optimum product mix using the simplex method (6 marks)
A

Solution


The objective function (z);
Zmax = 2x + y

Subject to the constraints

Raw material RM1 constraint:

3x ≤ 30

Raw material RM2 constraint:

2y ≤ 30

Raw material RM3 constraint

x + y ≤ 20

Non negativity constraint

x ≥ 0 y ≥ 0

(ii) The optimum product mix using the simplex method

1st Simplex table
Solution Variable Products Slacks variable Solution quantity
x y S1 S2 S3
S1 3 0 1 0 0 27
S2 0 2 0 1 0 30
S3 1 1 0 0 1 20
Z 2 1 0 0 0 0
Pivot column


27 / 3 = 9, 20 / 1 = 20, 30 / 0 = 0

2nd Simplex table
Solution Variable Products Slacks variable Solution quantity
x y S1 S2 S3
X 1 0 1/3 0 0 9
S2 0 2 0 1 0 30
S3 0 1 -1/3 0 1 11
Z 0 1 -2/3 0 0 -18
Pivot column


9 / 0 = 0, 30 / 2 = 15, 11 / 1 = 11

3rd Simplex table
Solution Variable Products Slacks variable Solution quantity
x y S1 S2 S3
X 1 0 1/3 0 0 9
S2 0 0 2/3 1 -2 8
Y 0 1 -1/3 0 1 11
Z 0 0 -1/3 0 0 -29


Hence, the company should produce 9 units of product x and 11 units of product y so as to maximize the weekly profit

max z = 2(9) + 1(11) = 18 + 11

maximum profit = Sh. 29 per week


QUESTION 5(a)

Q (i) The probability that no transfomer will be struck by lightning in a week. (3 marks)

(ii) The probability that at most two transformers will be struck by lightning in a week. (5 marks)
A

Solution


P(r) = e λ r / r!

where;

e = 2.7183

r = number of successes and r = 0,1,2,... n

入 = mean occurences

Therefore,

e = 2.7183

r = 0

入 = 0.4 per week

P(r = 0)
=
2.7183-0.4 x 0.4o

0!
= 0.6703


(ii) The probability that at most two transformers will be struck by lightning in a week.

p(r ≤ 2) = p(r = 0) + p(r = 1) + p(r = 2)

p(r = 0) = 0.6703

P(r = 1)
=
2.7183-0.4 -0.41

1!
= 0.2681


P(r = 2)
=
2.7183-0.4 - 0.42

2!
= 0.0536


p(r ≤ 2) = 0.6703 + 0.2681 + 0.0536 = 0.992

Hence, the probability that most two transoformers be struck in week 0.992 or 99.2%


QUESTION 5(b)

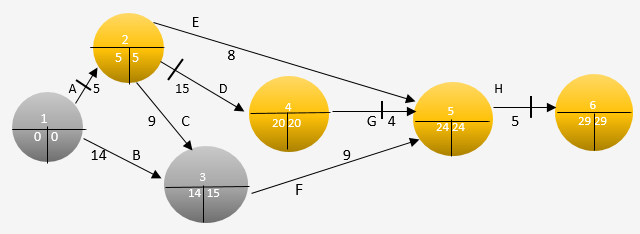
Q (i) The network diagram for the project. (8 marks)
(ii) The critical path. ( l mark)
(iii) The probability of completing the project within a 30 - week duration, (3 marks)
A

Solution


Expected/Average time (te)

Where;
a = most optimistic time estimate
m = most likely estimate
b = most perstimistic time estimate
Variance (δ²) = [(b - a) / 6]²

Activity Expected/Average time(Weeks)

te
=
a + 4m + b

6
Variance

δ2 = [(b - a) / 6]2
A 5 2.7778
B 14 7.1111
C 9 0.1111
D 15 2.7778
E 8 0.4444
F 9 0
G 4 0.4444
H 5 0


(ii) The critical path

Is: A - D - G - H with a project duration of 29 weeks

(iii) The probability of completing the project within a 30 - week duration, (3 marks)

z = (t1 - te)/δ

δ = √(2.7778 + 2.7778+ 0.4444 + 0)

√6 = 2.4495 weeks

te = 29 weeks
t1 = 30 weeks

z = (30 - 29) / 2.4495 = 0.41

P(z ≤ 0.41) = 0.5 + 0.1591

0.6591 or 65.91%....

Illustration


Comments on CPA past papers with answers:

New Unlock your potential with focused revision and soar towards success
Pass Kasneb Certification Exams Easily

Comments on:

CPA past papers with answers