Guaranteed

95.5% Pass Rate

CPA
Advanced Leval
Advanced Financial Management November 2017
Suggested solutions

Advanced Financial Management
Revision Kit

QUESTION 1(a)

Q How corporate governance impacts the dividend policy of a firm
A

Solution


Corporate governance refers to the system of rules, practices, and processes by which a company is directed and controlled. It encompasses the relationships between a company's management, its board of directors, shareholders, and other stakeholders. The dividend policy of a firm refers to the decisions and actions taken by the company's management regarding the distribution of profits to its shareholders in the form of dividends.

Corporate governance can have a significant impact on a firm's dividend policy in several ways:

➧ Board of Directors:

The board of directors plays a crucial role in determining the dividend policy of a firm. The board's composition, independence, and expertise in finance and governance matters influence the decision-making process. A well-structured and independent board is more likely to make informed decisions regarding dividend payouts.

➧ Shareholder Protection:

Effective corporate governance ensures the protection of shareholders' rights and interests. When shareholders have confidence in the company's governance practices, they are more likely to invest in the firm and expect a fair and consistent dividend policy. Companies with strong governance practices tend to have more transparent and predictable dividend policies.

➧ Financial Performance and Stability:

Corporate governance practices that promote financial discipline and accountability can impact dividend policy. Sound governance mechanisms, such as financial reporting standards, risk management practices, and internal controls, contribute to the financial stability of the company. A financially stable firm is better positioned to pay consistent dividends to its shareholders.

➧ Alignment of Interests:

Corporate governance helps align the interests of different stakeholders, including shareholders, management, and employees. When the interests of these stakeholders are aligned, it promotes a favorable environment for dividend policy decisions. For example, governance practices that link executive compensation to shareholder value creation can motivate management to adopt a dividend policy that rewards shareholders appropriately.

➧ Regulatory Environment:

Corporate governance frameworks and regulations set by the government or stock exchanges can influence dividend policies. Compliance with relevant regulations and guidelines can impact the timing, frequency, and amount of dividend distributions. Companies must adhere to legal and regulatory requirements related to dividend payments and disclose relevant information to shareholders.

➧ Access to Capital:

A firm's dividend policy may be influenced by its need for capital to finance growth opportunities or to meet financial obligations. Effective corporate governance practices can enhance a company's reputation and creditworthiness, making it easier to access capital markets. Companies with better access to capital may be more flexible in determining their dividend policies.


QUESTION 1(b)(i)

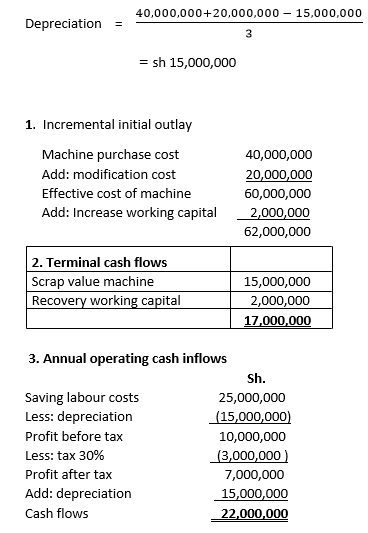
Q Advise to Viwanda Ltd. on whether to buy the machine
A

Solution


QUESTION 1(b)(ii)

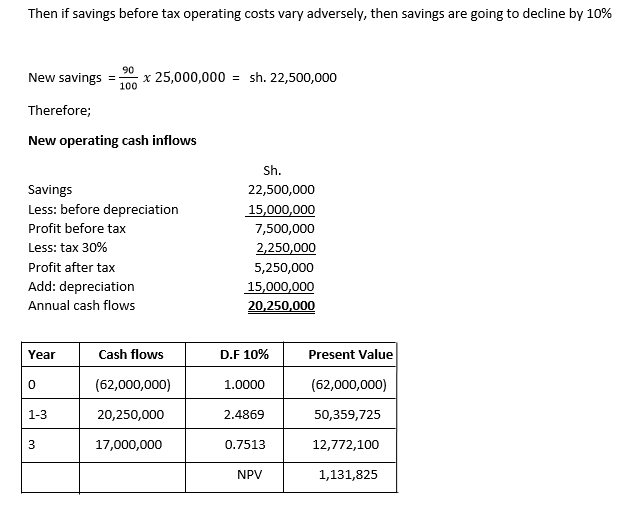
Q Suppose the firm's management is unsure about the savings in before tax operating costs.
Carry out a sensitivity analysis on this variable assuming that the variable shall vary adversely by 10%.
A

Solution


QUESTION 2(a)

Q Why economic value added(EVA) is gaining prominence as an alternative measure of a company’s financial performance:
A

Solution


➧ Focus on Shareholder Value:

EVA emphasizes the creation of shareholder value as its core objective. It measures the company's ability to generate returns in excess of its cost of capital. By considering the cost of capital, EVA provides a clearer picture of whether a company is truly creating value for its shareholders.

➧ Long-Term Perspective:

EVA encourages a long-term perspective by incorporating the cost of capital over time. It considers not only short-term profits but also the capital invested in the business. This long-term orientation aligns with the interests of long-term investors and encourages management to make decisions that create sustainable value.

➧ Holistic Performance Measurement:

EVA takes into account all operating expenses, including the cost of capital, which provides a more comprehensive view of a company's profitability. It goes beyond traditional accounting measures such as net income and earnings per share, which can be easily manipulated by accounting practices.

➧ Performance-Based Compensation:

EVA can be used as a basis for performance-based compensation systems, aligning executive incentives with value creation for shareholders. By linking compensation to EVA, executives are motivated to make decisions that improve the company's financial performance and increase shareholder value.

➧ Comparative Analysis:

EVA allows for better comparison of the financial performance of different companies. By focusing on the value created after accounting for the cost of capital, it provides a standardized metric that can be used across industries and companies of varying sizes.

➧ Management Tool for Value Creation:

EVA serves as a management tool for value creation. By analyzing the components of EVA, such as revenue growth, operating costs, and capital management, management can identify areas for improvement and make strategic decisions to enhance the company's financial performance.

➧ Investor Demand for Value-Based Metrics:

Investors are increasingly seeking alternative metrics that provide a more accurate assessment of a company's financial performance. EVA, with its focus on value creation, addresses this demand and provides investors with a measure that considers both profitability and capital efficiency.


QUESTION 2b(i)

Q (i) Euro Bond and Euro-notes:
(ii) An option is ‘in the money’ and ‘outofmoney’
A

Solution


➢ A Eurobond: is a debt instrument that's denominated in a currency other than the home currency of the country or market in which it is issued. Eurobonds are frequently grouped together by the currency in which they are denominated, such as eurodollar or Euro-yen bonds. Since Eurobonds are issued in an external currency, they're often called external bonds.

➢ Euro notes: are the paper banknotes that represent the euro currency, which is legal tender throughout the eurozone.

➢ ‘In the money’: An option is said to be‘in the money’ if it is exercised and gains are realized there from by the party exercising the option that is,holder of the option.

➢ ‘Outofmoney’: An option is said to be‘out of money’ if it is exercised and losses are incurred by the holder of the option.


QUESTION 2(c)

Q Calculate Jensen's alpha relating to "Faidika" and use it to evaluate the fund's performance.
A

Solution


Weighted portfolio beta = (600 / 100 × 1.4) + (40 / 100 x 1.9)

0.84 + 0.76 = 1.6.

Required return on portfolio.

Risk free rate + Beta (Return market - Risk free rate).

4.25 + 1.6(11.2 - 4.25).

15.37%.

Month Closing NAV Opening Nav Change NAV Dividend
per share
Total Return %Return
January 18.60 17.75 0.85 - 0.85 4.79
Feb 17.80 18.60 -0.80 0.75 -0.05 -0.27
March 18.20 17.80 0.40 - 0.40 2.25
April 18.00 18.20 -0.20 - -0.20 -1.10
May 17.80 18.00 -0.20 - -0.20 -1.11
June 16.80 17.80 -1.00 1.20 1.20 1.12
July 17.20 16.80 0.40 - 0.40 2.38
August 17.80 17.20 0.60 - 0.60 3.49
September 17.90 17.80 0.10 - 0.10 0.56
October 18.10 17.90 0.20 - 0.20 1.12
November 18.80 18.10 0.70 - 0.70 3.87
December 18.50 18.80 -0.30 - -0.30 -1.60
215.5 214.75 0.75 1.95 2.70 15.50


Tenses's Alpha = Actual return - Required return.

15.5% - 15.37%. = 0.13%.

Conclusion:

Since there is positive alpha, then above portfolio outperformed the market


QUESTION 3a

Q Reasons why acquisitions often fail to enhance share holders value
A

Solution


➧ Overpaying:

One of the primary reasons for failed acquisitions is overpaying for the target company. If the acquiring company pays a premium price that exceeds the actual value or synergies of the target company, it can result in a dilution of shareholder value.

➧ Poor Due Diligence:

Inadequate due diligence can lead to misunderstandings or underestimations of risks associated with the target company. If the acquiring company fails to identify potential issues such as financial problems, legal liabilities, or operational inefficiencies, it can lead to poor post-acquisition performance and a negative impact on shareholder value.

➧ Cultural and Integration Challenges:

Mismatched corporate cultures and difficulties in integrating the operations, systems, and employees of the acquiring and target companies can impede the realization of anticipated synergies. If the integration process is mishandled or takes longer than expected, it can result in disruptions, loss of key talent, and decreased operational efficiency, ultimately affecting shareholder value.

➧ Strategic Misalignment:

If the strategic rationale behind the acquisition is flawed or not aligned with the acquiring company's core competencies or long-term goals, it can lead to poor performance. Lack of synergy between the acquiring and target companies' products, markets, or business models can hinder the achievement of expected financial and operational benefits.

➧ Regulatory and Legal Challenges:

Acquisitions may face regulatory hurdles, such as antitrust concerns or government approvals, which can delay or block the completion of the transaction. Legal disputes or litigation arising from the acquisition can also drain resources and negatively impact shareholder value.

➧ Financing and Debt Burden:

If the acquiring company takes on excessive debt or uses unfavorable financing arrangements to fund the acquisition, it can strain its financial position and increase interest costs. This can lead to reduced profitability and cash flows, limiting the ability to deliver shareholder value.

➧ Market and Economic Factors:

Unforeseen changes in market conditions, industry dynamics, or economic downturns can significantly impact the success of acquisitions. Factors like changes in consumer preferences, technological disruptions, or macroeconomic instability can affect the anticipated synergies and financial performance of the combined entity.


QUESTION 3b

Q Advise whether the acquisition should proceed.
A

Solution


Total market value equity = no. of shares x MPS.
Mkuki equity value = 50 x 22 = Sh 1,100 million.
Ngao equity value = 65 x 2.4 = Sh. 156 million.
Total equity value = 1,100 + 156 = Shs 1256 Million.

Asset beta = Equity beta / (1 + D / E(1 - T)).

Mkuki asset beta = 1.37 / (1 + 60 / 1,100(1 - 0.3)).

1.37 / 1.038 = 1.32.

Ngao Ltd Asset Beta = 2.5 / (1 + 12.5 / 156(1 - 0.3)).

2.5 / 1.056 = 2.37.

Combined beta (β α ) = (1,100 / 1,256 x 1.32) + (156 / 1,256 x 2.37) = 1.45.

Where:

Bα = Asset Beta combined = 1.45.
Be = Equity beta combined D = Total debt value = 60 + 12.5 + 200 = Sh. 272.5 Million.
βe = 1.45 (1 + 272.5 / 125.6(1 - 0.3) = 1.67.

Combined cost of equity using CAPM = Risk free rate + Market risk premium x Beta.

5.2 + 3 × 1.67. = 10.21%.

Post Acquisition weighted average cost of capital (Ko).

Ko = Ke - (Ke - Kd)D/V.

10.21 - (10.21 - 7)272.5 / 1,528.5.

10.21 - 0.57 = 9.64%.

Year Combined cash(millions) DF 9.64% PV(millions)
1 60.3 + 15.2 = 75.5 0.9121 68.862
2 63.9 + 15.8 = 79.7 0.8319 66.301
3 67.8 + 16.4 = 84.2 0.7587 63.883
4 71.8 + 17.1 = 88.9 0.6920 61.521
5 76.1 + 17.8 = 93.9 0.6312 59.268
6 to 93.9(1.015)/0.0964 = 988.7 0.6312 624.053
943.89


Sh."million"
Present value cash flow 943.89
Sale of land 14.00
Mkuki debt (60.00)
Ngao debt 12.50
Post acquisition debt (200.00)
710.39


The post acquisition value of Sh. 710.39 million is less than current equity value of Mkuki of shs.1,100 million so acquisition is not sensible.


QUESTION 4(a)(i)

Q Find the operating profit (EBIT) indifference level associated with the two financing plans.
A

Solution


Number of shares issued = Amount raised from share issue/ Price per Share.

Shares issued financing optione one = 300 Million / 40 = 0.075 million shares.

Shares issued financing option two = 2 million / 40 = 0.05 million shares.

Debenture interest financing plan two = 14 / 100 x 1 = 0.14million.

Earnings per share plan one
=
EBIT(1 - T)

No.of shares
=
0.7EBIT

0.075


Earnings per share plan two
=
EBIT(1 - Interest)(1 - T)

No.of shares


0.7(EBIT - 0.14)

0.05
=
0.7EBIT - 0.098

0.05


At indifference point both financing plans will have the same eanings per share.


0.7EBIT

0.075
=
0.7EBIT - 0.098

0.05


0.05 × 0.7EBIT = 0.075(0.7EBIT - 0.098).

0.035EBIT = 0.525EBIT - 0.00735.

0.0175 EBIT / 0.0175 = 0.00735 / 0.0175.

EBIT = 0.42Million


QUESTION 4(a)(ii)

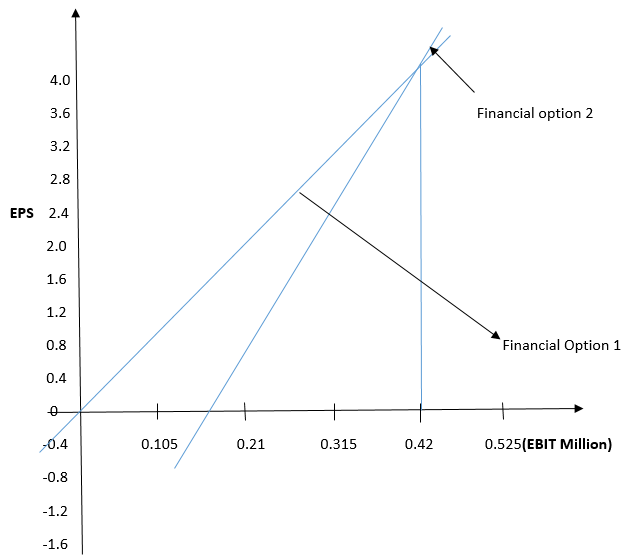
Q Construct an EPS-EBIT graph for the two financing plans.
A

Solution


Financing option one.

EPS = 0.7EBIT/0.075.

EPS 0 3.92 1.96 0.98
EBIT 0 0.42 0.21 0.105


Financial plan two.

EPS = (0.7EBIT - 0.098)/0.05.

EPS -1.98 3.92 1.98 -0.49
EBIT 0 0.42 0.21 0.105


QUESTION 4(a)(iii)

Q Determine the range of operating profit (EBIT) within which each financing plan above would be recommended.
A

Solution


Financing option one is recommended for any level where operating profit is below Shs. 420,000. For operating profit above Sh. 420,000 financing. Option is the best plan since it will you the highest earnings per share.


QUESTION 4(b)

Q (i) Using suitable calculations, demonstrate how under the Modigliani and Miller approach (without taxes), an investor holding 10 per cent of Alpha Ltd's shares will be better off in switching his holding to Beta Ltd.

(ii) Explain when, according to Modigliani and Miller (without taxes), the process described in (b) (i) above would come to an end.
A

Solution


(i) Using suitable calculations, demonstrate how under the Modigliani and Miller approach (without taxes), an investor holding 10 per cent of Alpha Ltd's shares will be better off in switching his holding to Beta Ltd.

Market value equity Alpha Ltd = 90,000,000 x 18 = Sh 1,620 Million.

Market value equity Alpha ltd = 90,000,000 x 18 = Sh. 1,620 Million.

Market value beta ltd.

150 million x 10 = 1,500 million.

Total value Alpha Itd = Equity + debt value.

1,620 + 60 = Shs.1,680 Million.

Interest on debenture Alpha Ltd.

6 / 100 x 60.million = 3.6 million.

Alpha ltd
Million
Beta ltd
Million
Operating profit 18 18
Less: Interest 3.6 0
Profit before tax 14.4 18


Ideally since the two firms have same operating, they should ideally command the same value. Thus to arbitrage on this.

1. Sell 10% of over valued firm Alpha amount raised to the equity and debt 10 / 100 x 1,680 = Sh.168 million.

2. Invest the disposal proceeds in Beta Ltd. The fraction of beta purchased.

168 / 1,500 = 0.112

3. The implication of selling a 10% stake in Alpha is that you will forgo 10% of the total profits made by Alpha. This means that you will no longer receive the portion of profits associated with the sold stake.

On the other hand, by purchasing 0.112 (or 11.2%) of Beta Ltd, you will be entitled to 11.2% of the profits made by Beta. However, this entitlement is subject to deduction for interest costs on the Sh. 6 million debenture that you borrowed.

"Sh.million"
0.112 of profit beta 0.112 x 18 2.016
Less:profit for gone 10 / 100 x 14.4 (1.44)
Interest on borrowing 6 / 100 x 6 0.36
0,216


Therefore arbitrage gained is Shs. 216,000.

ii) When the process described in (b) (i) above would come to an end according to Modigliani and Miller (without taxes)

The above process could continue till both firms command the same value.


QUESTION 5(a)

Q How Interest rate parity and Purchasing power parity could be used to forecast exchange rates.
A

Solution


Interest rate parity and purchasing power parity are two economic theories that can be used to forecast exchange rates.

How Interest rate parity and Purchasing power parity could be used to forecast exchange rates.

Interest Rate Parity (IRP):

Interest rate parity suggests that the difference in interest rates between two countries should be equal to the expected change in exchange rates between their currencies. This theory assumes that investors have equal access to financial markets and can freely borrow and lend at the prevailing interest rates.

➦ To use interest rate parity for exchange rate forecasting, one could follow these steps:

a. Identify the interest rate differential: Calculate the difference in interest rates between two countries. This could involve comparing the benchmark interest rates set by their respective central banks or analyzing the yields on government bonds.

b. Forecast exchange rate movements: If the interest rate in one country is higher than in the other, according to interest rate parity, the higher interest rate currency is expected to depreciate relative to the lower interest rate currency. Conversely, if the interest rate in one country is lower than in the other, the higher interest rate currency is expected to appreciate relative to the lower interest rate currency.

c. Monitor deviations: Continuously monitor any deviations from interest rate parity. If there are persistent deviations, it may indicate potential arbitrage opportunities, where traders can exploit the mispricing in the foreign exchange market.

Purchasing Power Parity (PPP):

Purchasing power parity suggests that the exchange rate between two currencies should adjust to equalize the prices of a basket of goods and services in both countries. It assumes that in the long run, exchange rates will move to reflect differences in inflation rates between countries.

➦ To use purchasing power parity for exchange rate forecasting, you can follow these steps:

a. Calculate relative price levels: Determine the price levels of identical or similar goods and services in different countries. This can be done by comparing consumer price indices or specific price indicators.

b. Calculate the implied exchange rate: Divide the price level of one country by the price level of another country to obtain the implied exchange rate.

c. Compare the implied exchange rate with the current exchange rate: If the implied exchange rate differs significantly from the current exchange rate, it suggests that the currency is overvalued or undervalued. In theory, the exchange rate should adjust over time to align with the implied exchange rate, thus providing a basis for forecasting future exchange rate movements.


QUESTION 5(b)

Q Forward market cover.
A

Solution


Net Payments USA = $240,000 - $69,000 = $171,000.

(a) Forward market hedge payment $ 171,000.

Forward rate 1€ = $ 0.9520.
? = $171,000.

$171,000 / $0.9520 = €179,621.85.

(b) Forward market cover receipts of australlian dollars 395,000.

Forward rate 1 ASD = € 1.9540.
395,000 ASD = ?.

Thus;

395,000 × 19,540 = €771,830


QUESTION 5(b)(ii)

Q (ii) Money market cover.
A

Solution


It entails using money market instruments to safeguard against forex losses.

1. Hedging payments of $171,000.

Deposit an amount equivalent to the present value of $171,000 at rate of 10% annualized over a 3 month period.

PV = $171,000 [1 + (0.1×3/12)]-1 = $171,000 × 1.025-1 = $166,829.27.

2. Convert the present value of above amount at current prevailing spot rate.

1€ = $0.9830.
? € = $166,829.27.

€166,829.27 / 0.9830 x 1.

= €169,714.42.

3. Borrow the euros 169,714.42 at annualized rate of 13% over a 3 month period. The future value of above amount.

= € 169,714.42 [1 + (0.13 x 3 / 12)].

€169,714.42 x 1.0325 = € 175,230.14.

Hedging receipts of ASD 395,000.

1. Borrow an amount equivalent to the present value of ASD 395,000 at an annualized rate of 16% over a 4 month period.

PV = ASD 395,000[1 + (4 / 12 x 0.16)]-1 ASD 395,000 × 1.0533-1.

ASD 375,000.

2. Convert above amount to euros at the prevailing spot rate. Being a receipt the selling exchange spot applies.

1 ASD = € 1.8920.
375,000 ASD = €?.

Tharefore:
375,000 x 1.8920 = € 709,500.

3. Invest the Euros 709,500 at annualized rate of 11.5% over a 4 month period. The future value of above amount.

= €709,500 × [1 + (4 / 12 × 0.115)].

= €709,500 x 1.0383 = €736,697.50


Comments on CPA past papers with answers:

New Unlock your potential with focused revision and soar towards success
Pass Kasneb Certification Exams Easily

Comments on:

CPA past papers with answers